ASTER Image Processing for Greater Phoenix
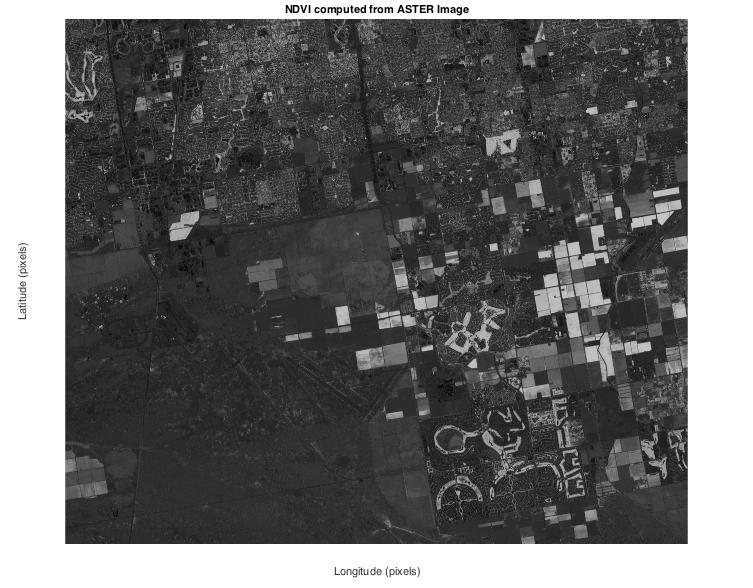
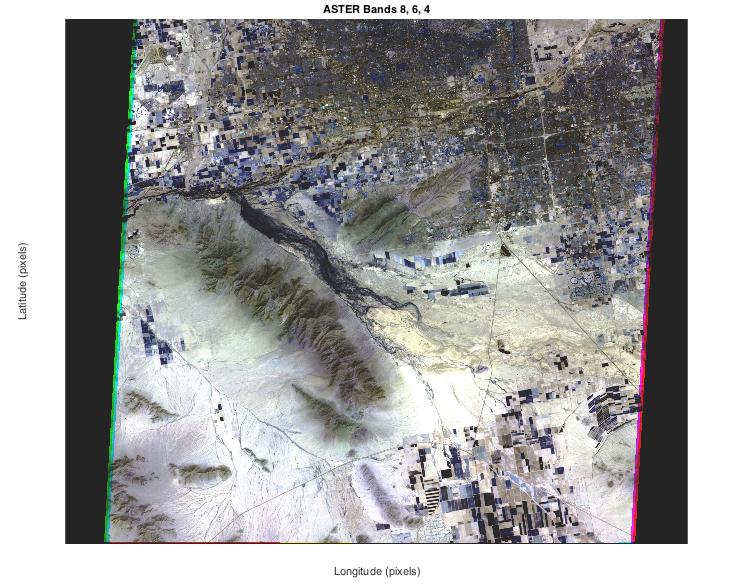
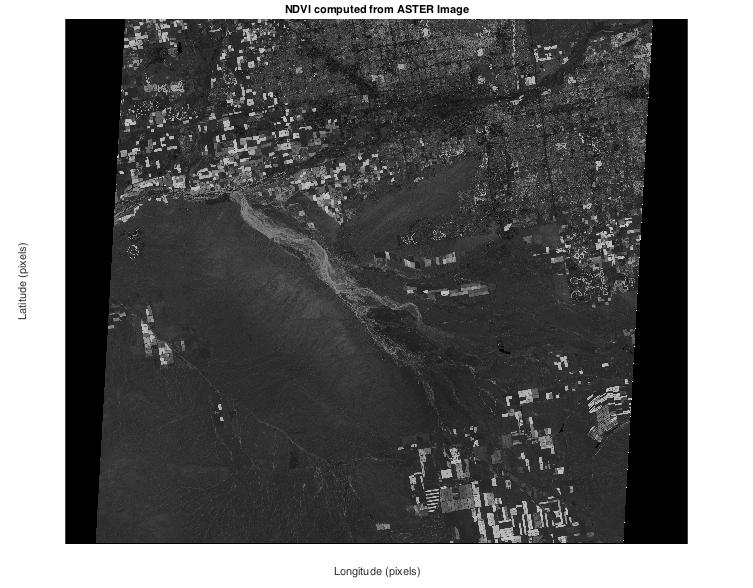
This webpage contains images of the greater Phoenix area built from ASTER data using Matlab to display various readings of wavelength including bands from CIR, SWIR, TIR, and NDVI spectra. By utilizing these spectra, we can gain a better understanding of the geospatial makeup of the natural and urban environment we live in. To see how I pulled these data, and implemented them into these images, I have provided a link to my Matlab script for further analyses and utilization below.
Phoenix ASTER Image Processing Script
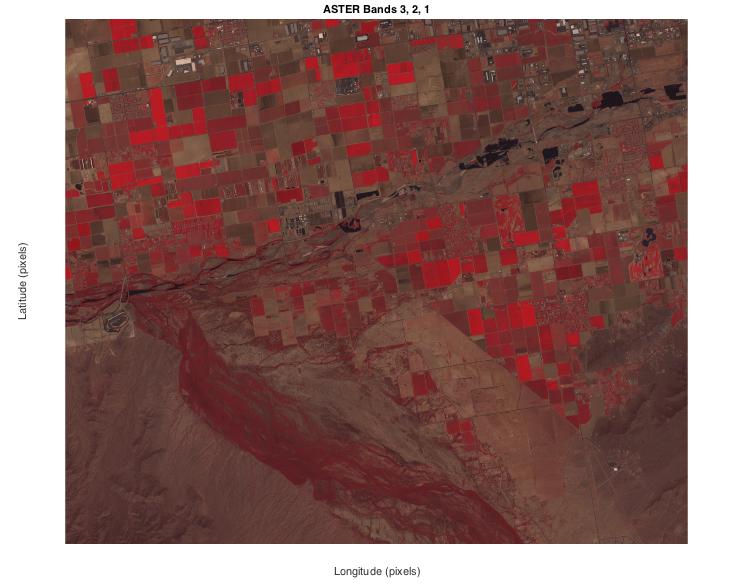
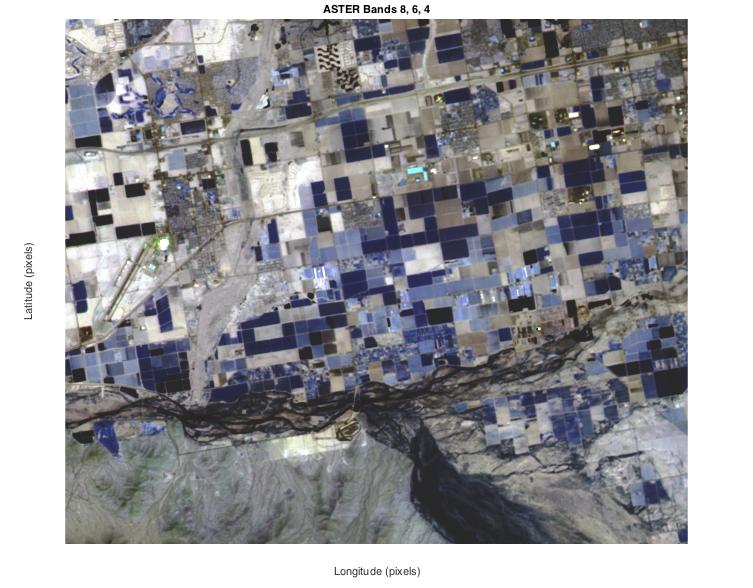
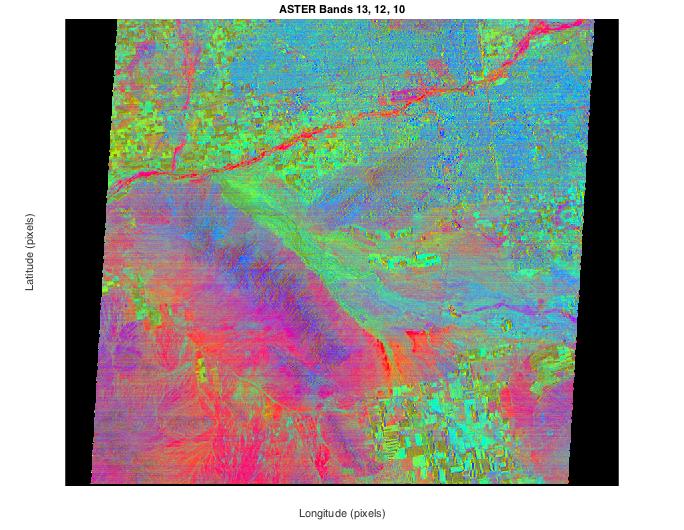
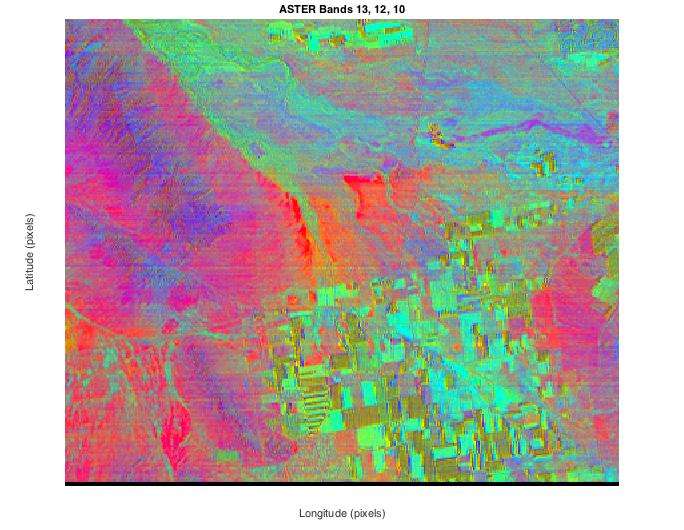
To begin with, these two images below are of the greater Phoenix area showing feedback from CIR imaging, the first being the entire region and the next being a zoomed in image depicting a specific area that shows a great diversity of CIR values on the surface. In large red lettering next to the image signifies which is zoomed and which is not, to avoid any confusion on the matter.
Regular
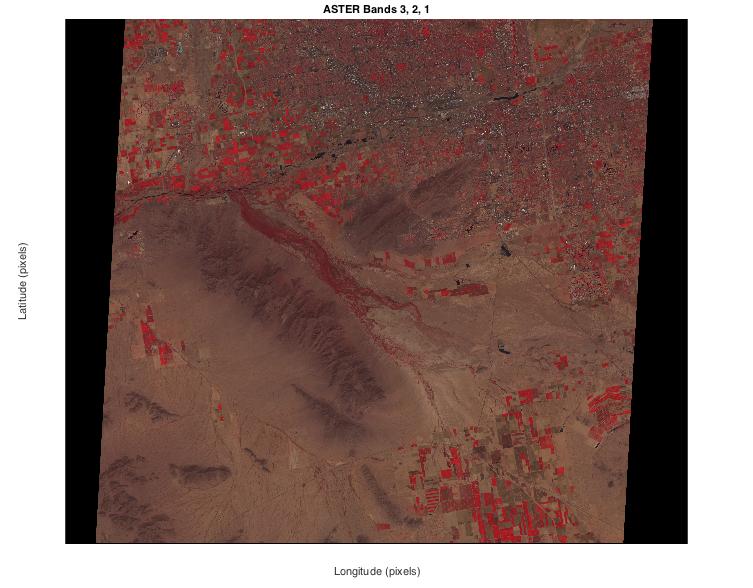
Zoomed
Regular
Zoomed
Regular
Zoomed
Regular
Zoomed